Topics covered in this FAQ:
(If your question is not covered on this page, please send an email to info@eventloggers.com and we'll respond quickly.)- Why should I use EventLoggers.com when there are so many other personal data tracking solutions out there?
- Details about privacy
- What types of Event data can I log?
- How can I get Event data in to the website?
- What can I do with my Event data?
Why should I use EventLoggers.com when there are so many other personal data tracking solutions out there?
EventLoggers.com has a few unique features including an integrated Daily Journal, logging Events for the whole family, robust Voice Logging via Google Home/Assistant and fine-grained data export. Our goals are:
- To make it so easy for you to log the Events of your day, that you'll soon have a gold mine of personal data at your fingertips.
- To give you the best tools to track, explore and leverage your personal data so you can take charge of your days.
Members who log regularly can expect these benefits:
Capture the details of your days, forever
Look back on any day to see the details of what you did, what you were thinking about and how you felt.
Quick and easy logging means you can track your whole day...
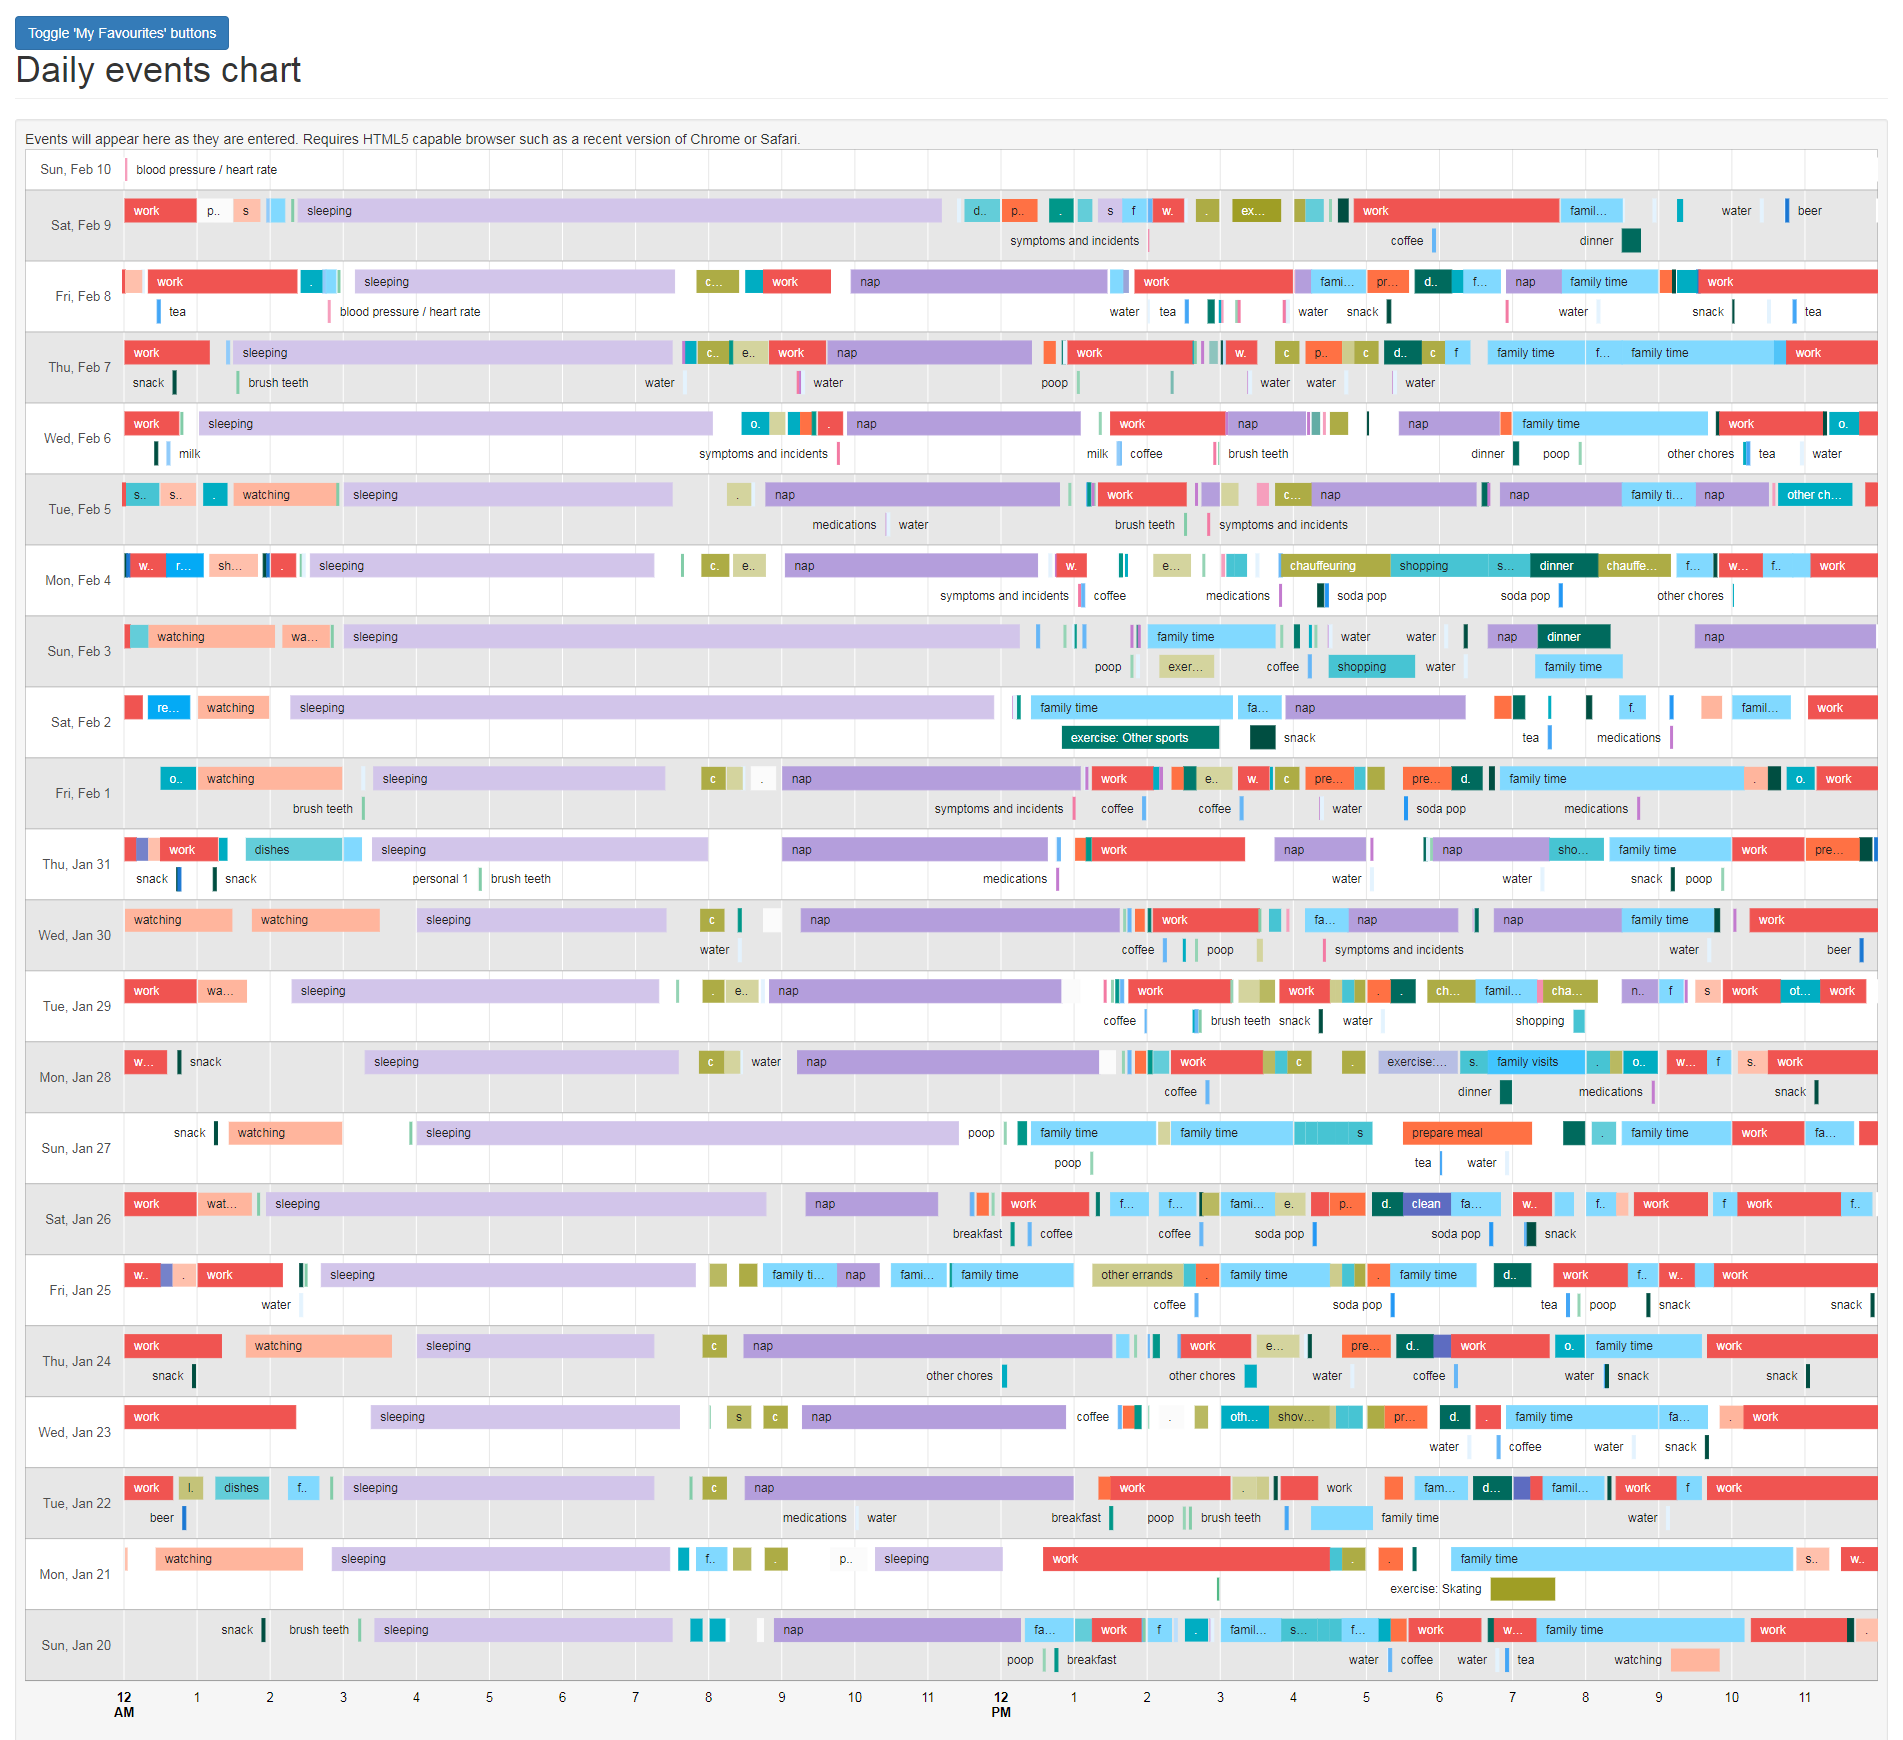
It only takes a few minutes each day to build a detailed, colour-coded and clickable chart of your daily Events.
Become more self-aware
When you take a few seconds to record an Event, you capture it forever. When you take a few minutes to write down your thoughts or feeling, you have access to them forever. When you combine both over a period of time and then examine the patterns, you learn about yourself in ways that are otherwise elusive.
Keep your life in balance
Daily Activities Dashboard charts your time spent with work, sleep, exercise, family, chores and leisure. See your last week, month and three months at a glance to identify changes over time. Extrapolate the "90 Day Trends" stacked bar graph and trend lines to see what lies ahead.
When you log your days, you can visualize where your time goes...
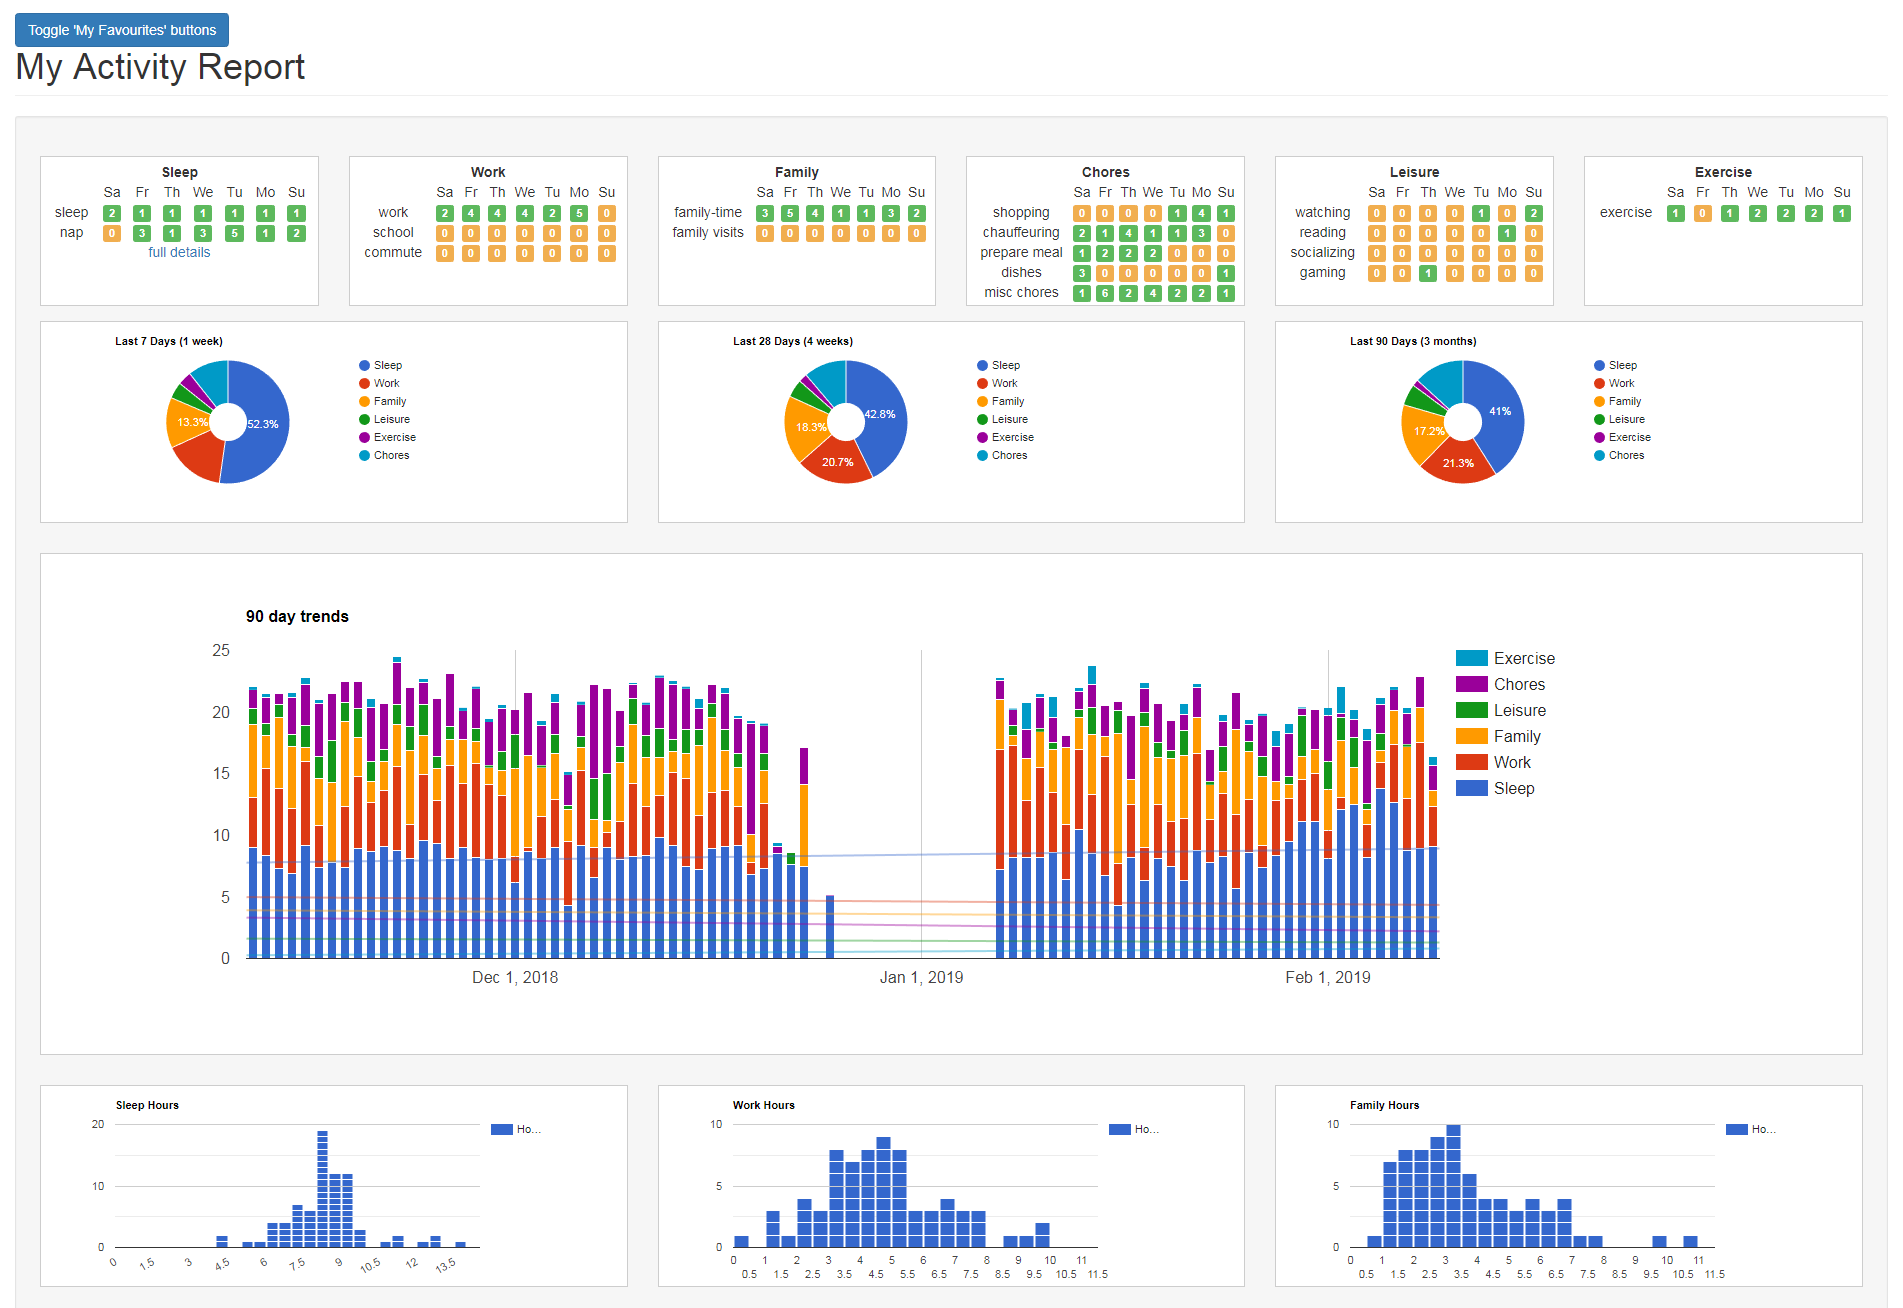
Pre-configured Dashboards are used throughout the site to present your data in useful ways. The Activities Dashboard illustrates where you spend your time across six dimensions - sleep, work, family, leisure, exercise and chores.
Tune in to your Health
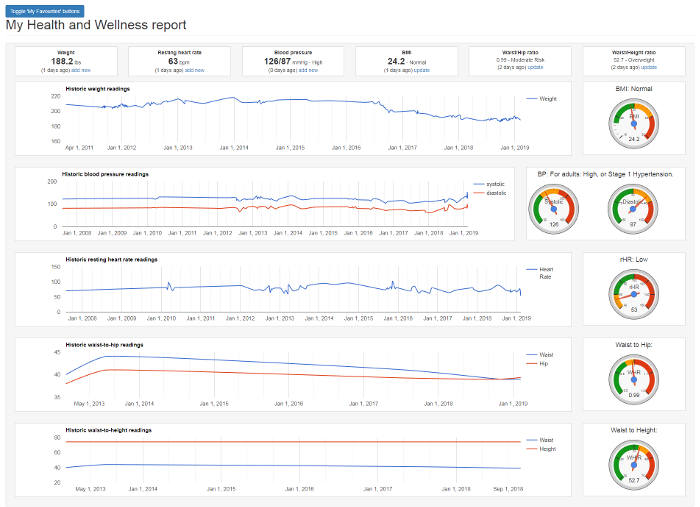
Health and Wellness Dashboard charts your weight, blood pressure, resting heart rate and various metrics so you can view your key personal health indicators on one screen.
Tune in and track your personal health indicators...

The Health and Wellness Dashboard allows you to see your historical personal health indicators over time. If you have existing records of previous measurements, you can enter them to quickly build a personal health and wellness timeline, then add to it over time.
Break down your food choices
Your Foods Dashboard analyzes what you eat into more than two dozen categories and displays how often they've been a part of your meals.
If you add photos of your meals, you can use the Visual Food Explorer's filters to find your favorite (and least favorite) meals from the past.
Do you know how often you eat various types of foods?
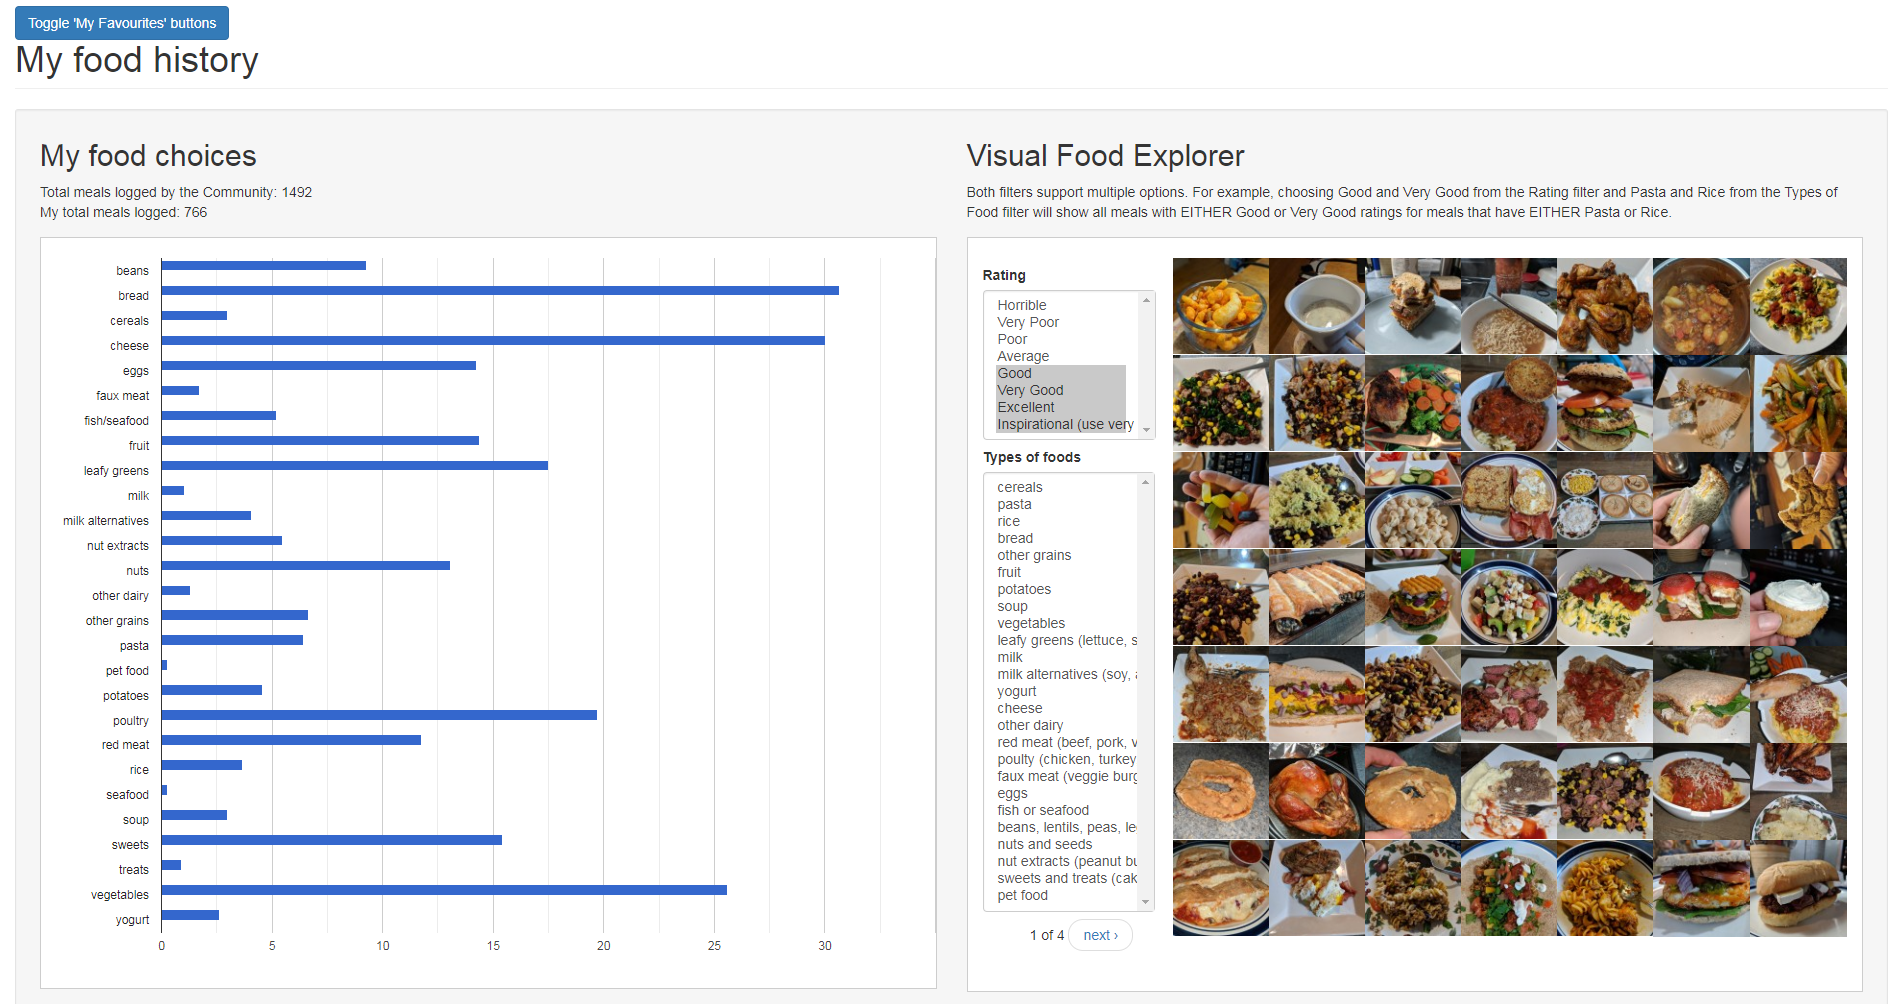
They say, "You are what you eat." Well, if that's the case, I'm mostly bread, cheese, veggies and poultry! I've also been taking photos of my meals for quite a while and including ratings.
Step up your hydration knowledge
Don't just track your daily water consumption. Include caffeine, sodas and alcohol for true insight into what you drink. One Dashboard to view what you've drank so far today and for the last week, month and 90 days.
Are you on top of your hydration, caffeine and alcohol consumption?
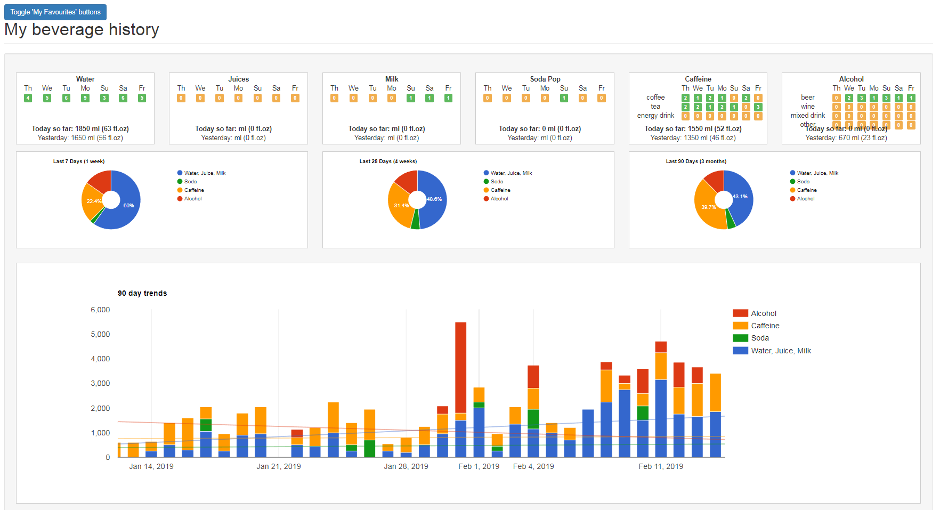
The Beverages Dashboard summaries what you drink into four broad dimensions: caffeinated beverages, sodas, alcoholic drinks and water/juice. It offers summaries for seven days, 28 days and 90 days.
Explore the trends and details of your Events
There's a dedicated Dashboard for every type of Event you log. Including a Daily Frequency chart, Time of Day Chart and a full list with searchable Notes and a Ratings filter.
Discover connections between the Events you Log
You can chart any type of Event with any other type. Compare frequency, time of day, and ratios for the last week, month and quarter.
Reap the benefits of digitizing your diary or journal
Add photos and relevant links to your Entries. One-click access to similar posts with free-tagging of Entries. Full text searching. Detailed statistics including average words per day.
Daily Journal/Diary integrates with your daily Events...
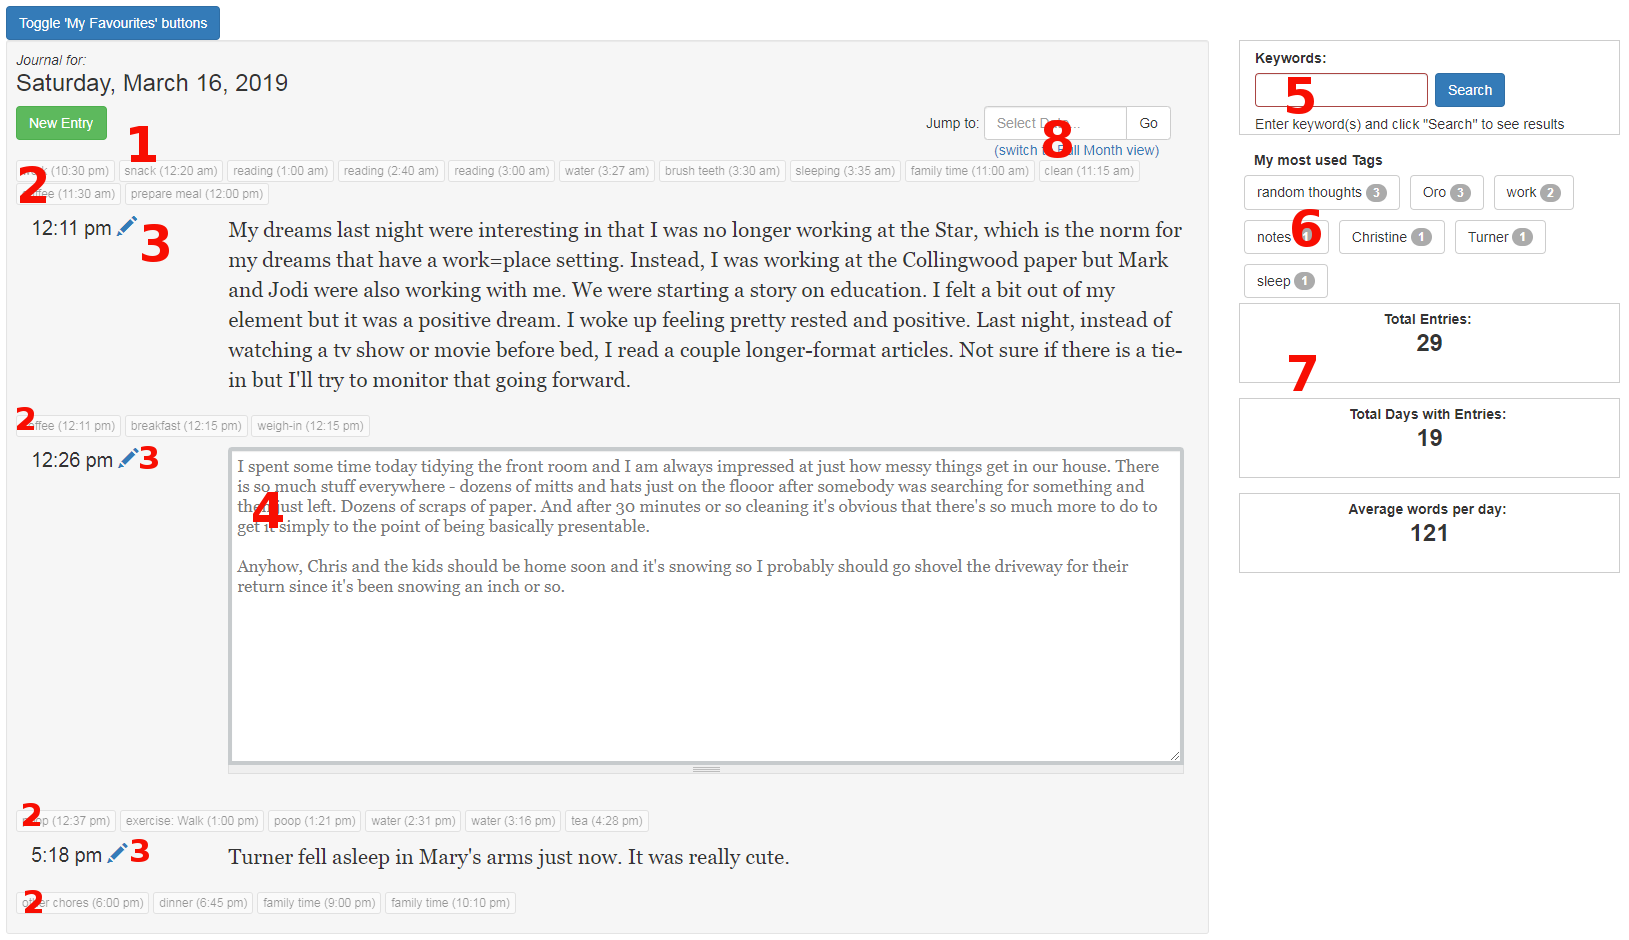
The mobile friendly Journal features One-click Entries from any Journal page(1), integrated listing of Events(2), Full Edit mode(3), Quick Edit mode(4), full text searching(5), custom categories(6), automated statistics(7) and jump-to date selection from any Journal page(8).
Fast and easy Voice Logging
Just say, "Talk to Event Logger" to log your Events with Google Home/Google Assistant.
Interested? Use the contact form for Beta access to this feature. In this short screencast, I'm back-logging my day's Events using Google Assistant (you can see my phone's screen in the bottom right:
Full family Logging
You can create new Member accounts that are under your control. Useful if you want to track Events for kids and/or pets, for example. You can also add accounts for other adult Family Members and they can share in the logging and viewing of everyone's Events.
Interested? Here's a six minute screencast that shows the whole process for adding both child and adult accounts:
Privacy
Who owns my data?
You own all of your own Event and Journal data. As a Member of the website, you agree to license your data so that we may use it in non-identifying ways to deliver useful information to you and to other Members and visitors of the website. If you choose to not be a Member any more, your Journal entries will be removed and you will have the choice of removing all your Event data completely or having it anonymized so it can continue to contribute.
Who has access to my Event and Journal data?
Your Event and Journal data is private not shared with any third parties by Event Loggers.
If you use Google Home to send data to EventLoggers, Google does record and store your commands. You can review and remove what Google has stored at https://myactivity.google.com/myactivity. Google also offers a comprehensive overview of what it does with the voice data it stores on this page.
Additionally, when you enter data via your computer or phone browser, the data is encrypted via https on its journey from your device to the server.
Who has access to my site visitation data?
We use Google Analytics to measure traffic to the website. When you visit a page on EventLoggers.com, a script supplied by Google called a "Tracking Code" collects information about the page you're visiting, the time, your publicly visible IP address and other visitation information. Your IP address is stripped out by Google and not included in any reports. Google provides a good overview of what it collects via the Google Analytics Tracking Code here.
We do not share your site visitation data with any other third parties.
Can I get a copy of my data?
Yes. You can download some or all of your data at any time.
Can I remove my data?
Absolutely. It's your data and you can request to have all or a portion of your Event data completely and permanently removed from the website. We'll do it quickly too.
What types of Event data can I log?
We currently have a hundred or so "Daily Events" that can be logged, including meals, exercise, health indicators and symptoms, daily routines such as sleep patterns, commute times, chores, leisure, family times and lots more. See the full list here. For Members with above-average privacy concerns, we have also set aside 3 "private" event types that only you know what they stand for.
For every Event you can log:
- the Type of Event
- start time
- end time (optional)
- add notes (optional)
- include a rating (optional)
- include one or more photos (optional)
Additionally, many Events have additional optional elements that can be logged:
- allow you to add the types of foods for each meal.
- All Beverage-related Events allow you to add the size of the drink.
- Weigh-ins: weight, body fat, hydration.
- Blood-pressure: diastolic and systolic readings, along with heart-rate.
- Symptoms and incidents: Type of symptom, severity, affected areas.
- Exercise: Type of exercise, intensity.
How can I get Event data in to the website?
Via the website:
- From your 'Log Events' page, you can add any event. You can also see Event Report pages for all Events that you've already entered.
- For access to regularly logged Events, you can modify your Favorite Events button to have easy access to your top 12 Favorite Events.
Via your smart phone:
- Visit Eventloggers.com in your smart-phone's browser and log in. The website is mobile friendly.
- Your Favourite Events button will show up near the top of every page.
- There is a toggle menu in near the top right that allows you to move around the site.
Via Google Home/ Google Assistant:
- We are in the process of adding this functionality. Beta testers are welcome to apply.
What can I do with my Event data?
View Report pages
After you've logged a few instances of an Event, click the 'Log Events' tab and then click on the small 'R' beside the Event to see your Report.
Event Report pages show a variety of information and charts relating to the Event, including a full list, a "calendar" style frequency report and a Time of Day chart. For example, on one screen you can see the number of cups of coffee you've had each day, when you've had them and a detailed list including any notes you made. There are also quick buttons for downloading data and for charting it against any other Event.
Compare Event stats
More information coming soon.
Analyse your Activity Report
Here's a six minute walk-through of my real-life Activity data that shows how I use the Activities Dashboard to stay on top of how I spend my days.
Track your Health and Wellness
Here's a screen grab of my real-life Health and Wellness Dashboard. I use it to track my weight, BMI, resting heart rate, blood pressure and a couple other health indicators (waist to hip ratio and waist to height ratio) because I'm not 100% sold on BMI being a fully accurate calculation.